The impact of humidity on global demand for cooling energy
Recent studies have highlighted the countries most affected by the need to adapt to rising temperatures. Assessing the impact of humidity on perceived temperatures also stresses out countries at risk of energy shortage during prolonged heatwaves, and the need for energy storage.
Cooling degree days (CDD) represent an indicator of how much and for how long the outdoor air temperature is above a certain threshold, usually 18°C. For example, a day with a mean outdoor temperature of 30°C has 12 CDDs. CDDs are considered an effective metric to estimate the energy demand for indoor cooling. Recent studies show that on average, CDDs are increasing worldwide, but their relative contribution to the energy demand is not uniform across the world. [1]
Countries most affected by an increase in cooling demand in a +2°C global warming scenario
N.D. Miranda et al. examined the impact on global cooling demand if the Paris Agreement’s preferred 1.5°C limit is overshot, and global mean temperature increases by 2.0°C. [2] By calculating the resulting absolute increase in CDDs, the authors found that the top ten countries that will experience the highest needs for cooling overall in a 2.0°C scenario are all in Africa, with Central Africa most affected.
When considering relative change (as opposed to an absolute difference in number of CDD), Northern countries are dangerously underprepared for this change. [2, 3] Switzerland and the UK will see a 30% increase in days with uncomfortably high temperatures, while Norway will see an increase of 28%. Climate adaptation interventions are required especially given that these results are a conservative estimate. Indeed, the authors did not take into account extreme heatwaves, which would come on top of this average increase.
A limit of this study is that CDDs were calculated using the dry bulb temperature following the standard approach, which does not account for the influence of humidity or other environmental variables on perceived thermal comfort.
The study was published in open access in Nature Sustainability.
Increase in cooling demand and energy storage in humid countries
Increased cooling demand is driven by high ambient air temperature and humidity. [4] Perceived temperature takes into account humidity, which worsens the physical discomfort caused by extreme heat, and thus represents a more accurate assessment of the expected increase in energy demand for cooling. [1]
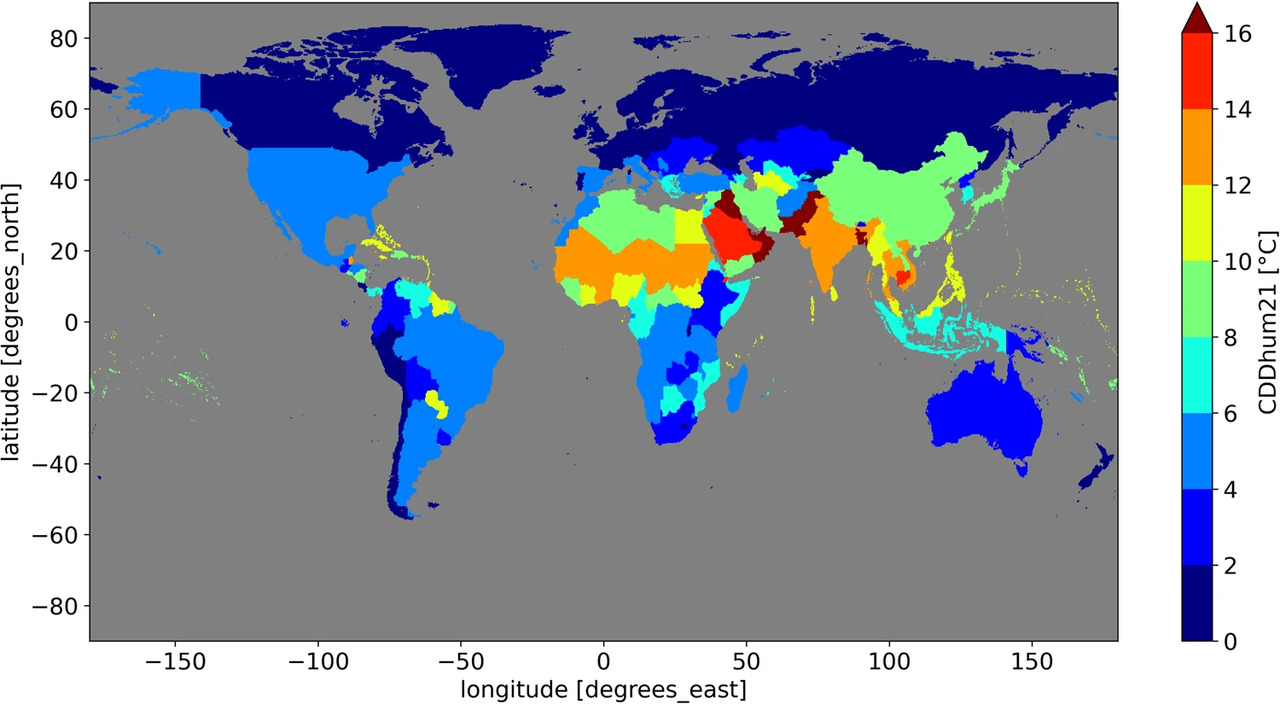
By selecting humidity-corrected cooling degree days at a 21 °C threshold, CDDhum21, E. Scoccimarro et al. found that most tropical countries are affected by increasing CDDhum21 even more than by the increase in dry CDD21. [4] Most of the countries in high demand for cooling, according to CDDhum21, are located in Asia and the Arabic Peninsula (Bahrain at the top). [4] For instance, the CDDhum21 per year has risen the most in Bangladesh with 22.31 °C per year between 2000 until 2020, meaning that the necessity of cooling increased considerably in intensity and duration. [4]
The authors also introduced the concept of clustering in time of extreme events, to measure if peaks occur evenly random or tend to cluster in shorter periods. According to E. Scoccimarro et al., “having a future where events tend to be more clustered means a higher need for energy storage.” [1] From an energy perspective, in case of a series of extreme temperatures events that require a great amount of energy for several consecutive days, there will be a higher need for energy storage along with the increased need for cooling.
The energy demand for cooling during consecutive periods of heatwaves will stress the energy grid under longer clusters and result in more frequent summer shortages, as is already the case in Southeast Asia. India, Cambodia, Thailand and Vietnam represent the emerging countries where this effect is the strongest. [4]
E. Scoccimarro et al. verified the importance of humidity and found that removing the effect of humidity in their analysis gave notable differences. For instance, the trend of clustering over India was only significant when humidity was considered and not when analysing dry CDD. However, in the case of Kuwait, Bangladesh and especially Niger, the trend towards clusters of extreme events is relevant in both dry and humid analysis, hence requiring more awareness on health and energy standpoints.

The study was published in open access in Communications Earth & Environment.
Researchers from the CMCC Foundation developed a database of energy-related climate indicators in partnership with the International Energy Agency (IEA). The IEA and CMCC Weather for Energy Tracker is available on the IEA website.